Connect your eToro account in one click, read-only. BullLens turns your positions,
trades and dividends into clear answers: how you are really doing, where your risk sits
and what your money will earn next.
bull-lens.com / overview
Demo account. Figures are examples.
10+pages of analysis, from Overview to Tools
5 yrsof dividends rebuilt from your real units
10 minsteps in the live Today chart
8share card templates in 4 formats
Overview
Measure yourself against the market
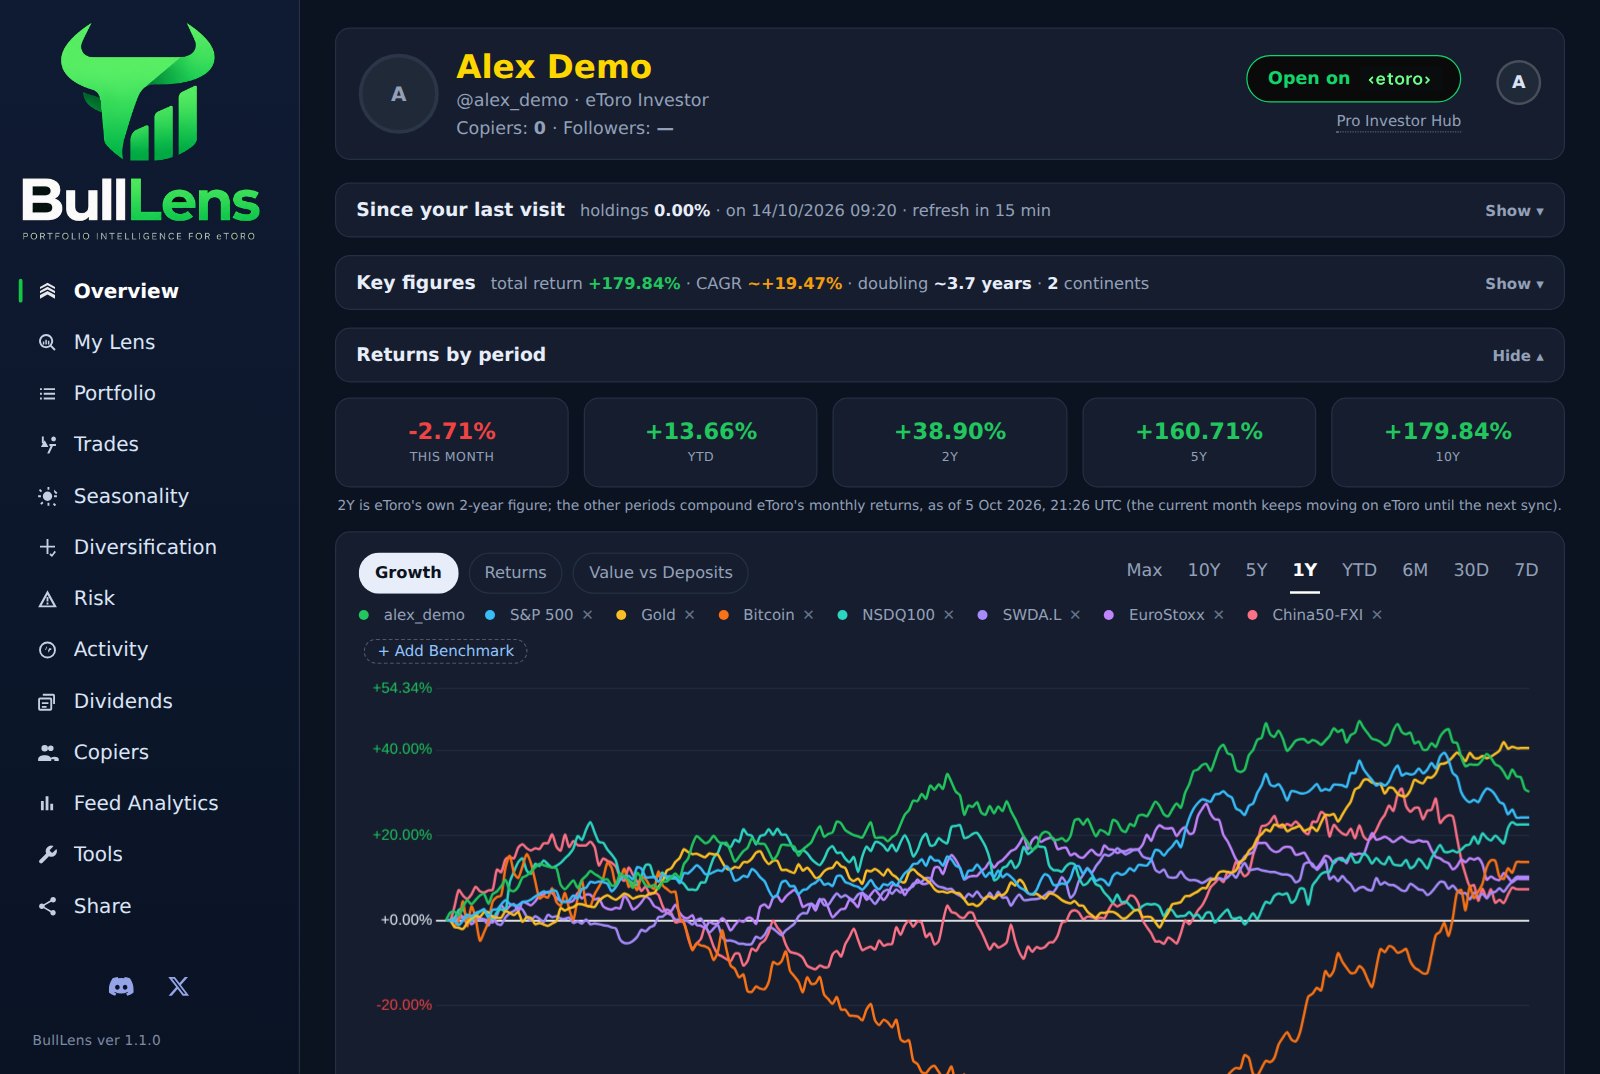
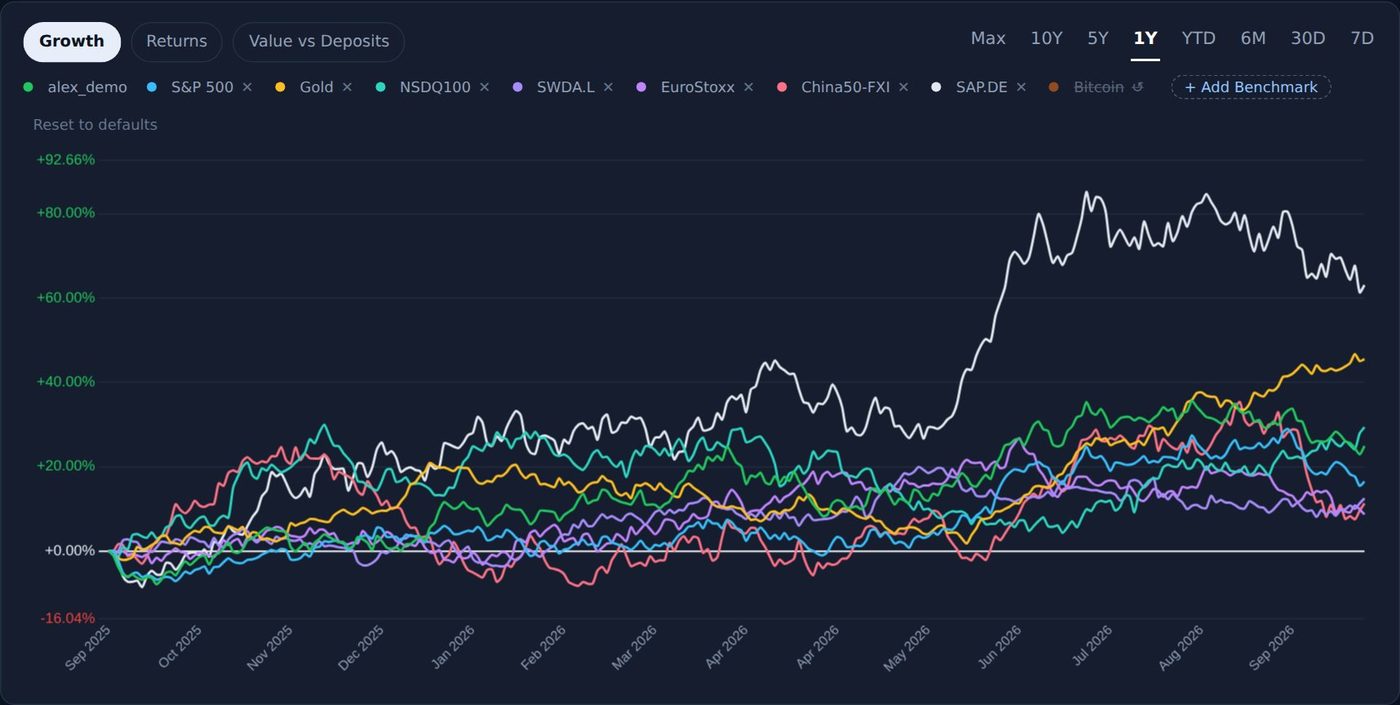
See your growth next to the S&P 500, Nasdaq 100, Gold and Bitcoin, from 7 days to 10 years. Hide the ones you don't care about and add any eToro instrument as your own benchmark.
Returns by period: month, YTD, 2, 5 and 10 years at a glance
Value vs deposits: how much is growth and how much is new money
Since your last visit: what changed while you were away
Portfolio · Today
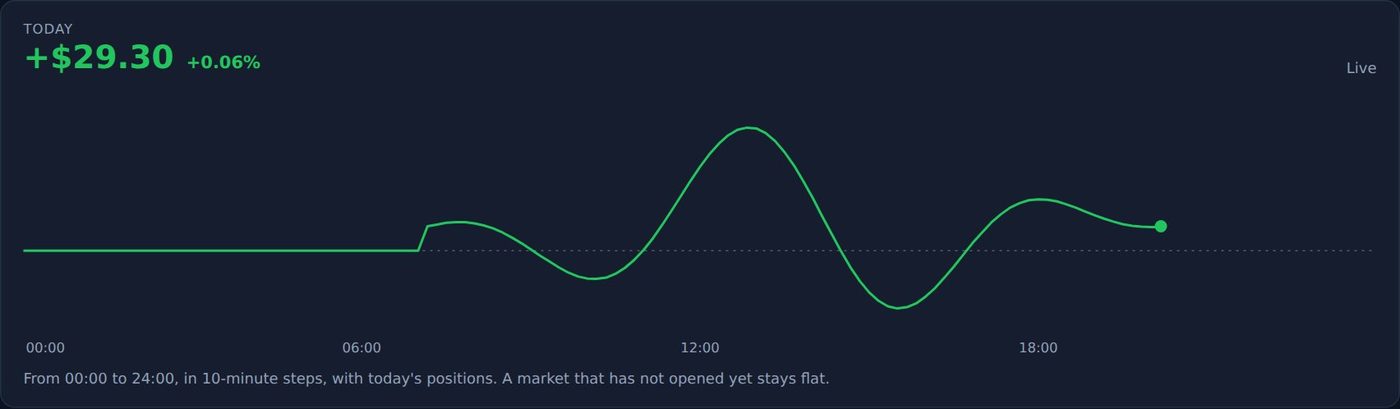
Your day, ten minutes at a time
A live curve of today's profit and loss, built from every position you hold. Markets that haven't opened yet stay flat, so the line tells the truth about your day.
Daily P/L per position, reconciled with eToro's own figures
24/5 US stocks and European closes handled correctly
Treemap of the day, week, month or year
Trades
Learn from every trade you closed
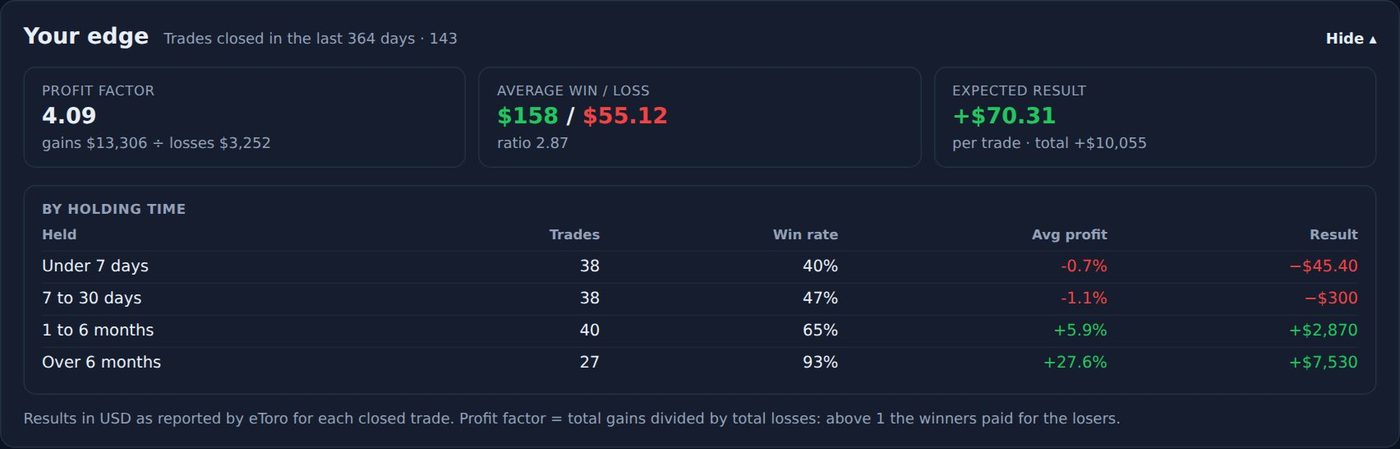
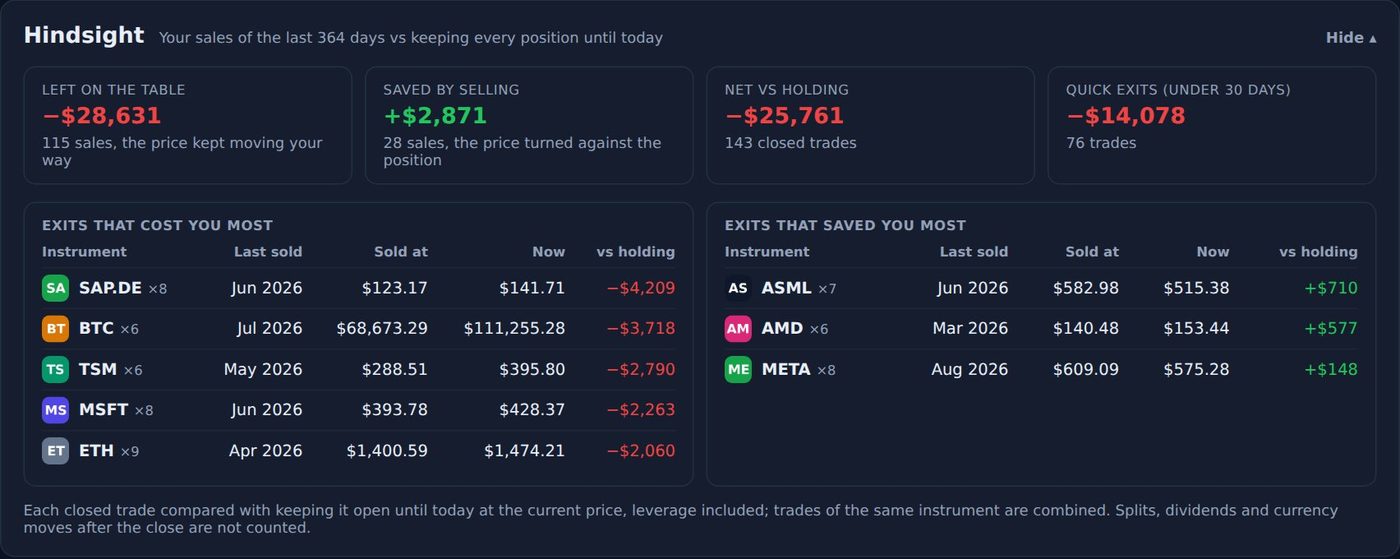
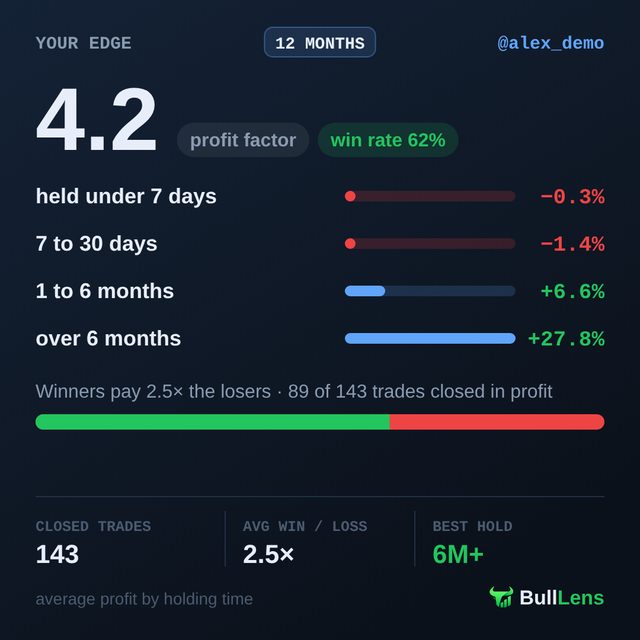
Your edge shows whether your winners pay for your losers, and how your results change with holding time. Hindsight compares every sale with keeping the position until today.
Profit factor, average win and loss, expected result per trade
Exits that cost you most, and the ones that saved you
Quick exits under 30 days, with what they really cost
Dividends NEW
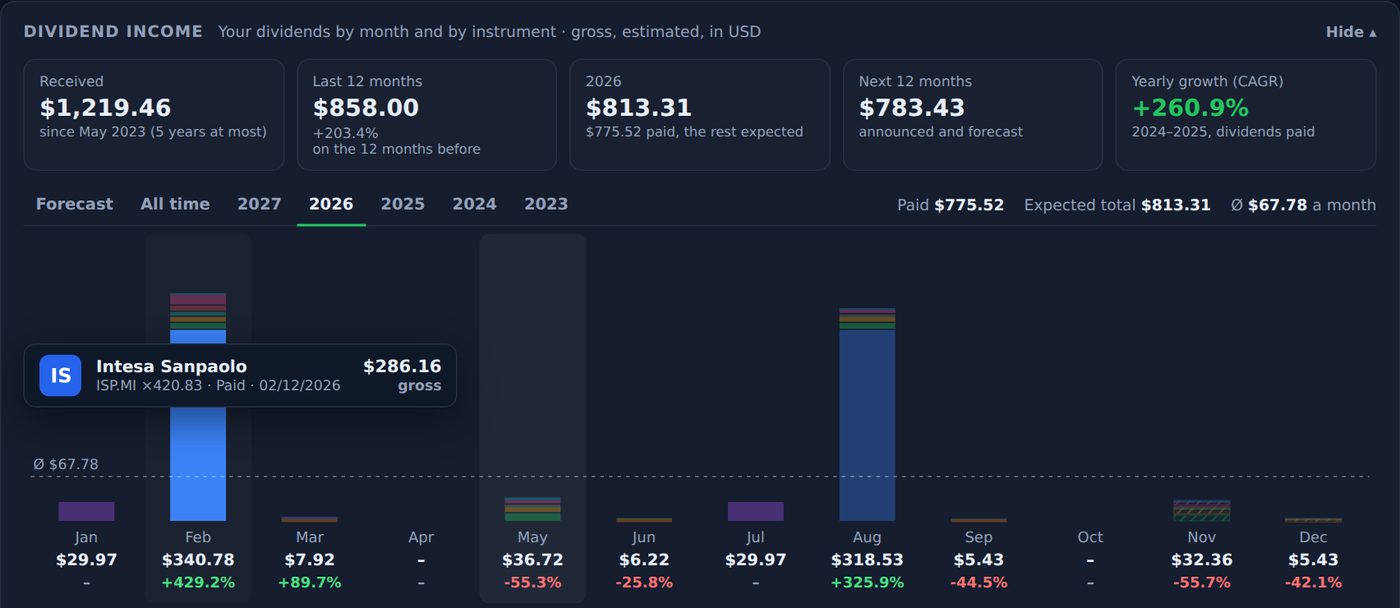
Your dividend income, month by month
Five years of dividends rebuilt from the units you actually held on each ex-date, plus what is announced and what to expect until the end of next year.
Paid, announced and forecast, grouped by the month the money arrives
Pay dates and declared amounts for US stocks
Year over year growth of every payment
Diversification · Ticker check
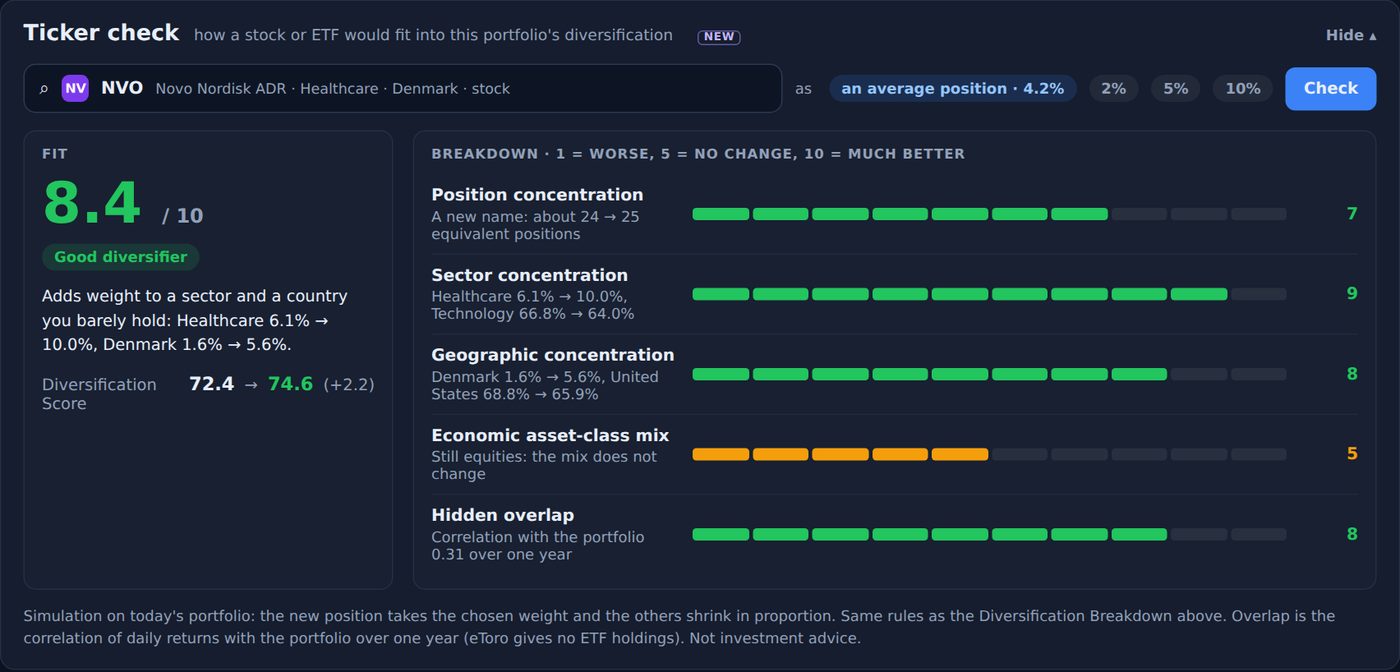
Test a stock before you buy it
Type any stock or ETF and choose how much you would put in. BullLens simulates the new portfolio and scores how well it fits, from position and sector concentration to hidden overlap with what you already own.
Fit score from 1 to 10, with the reason in plain words
Diversification Score before and after
Sectors, countries and asset classes of your whole portfolio
Risk
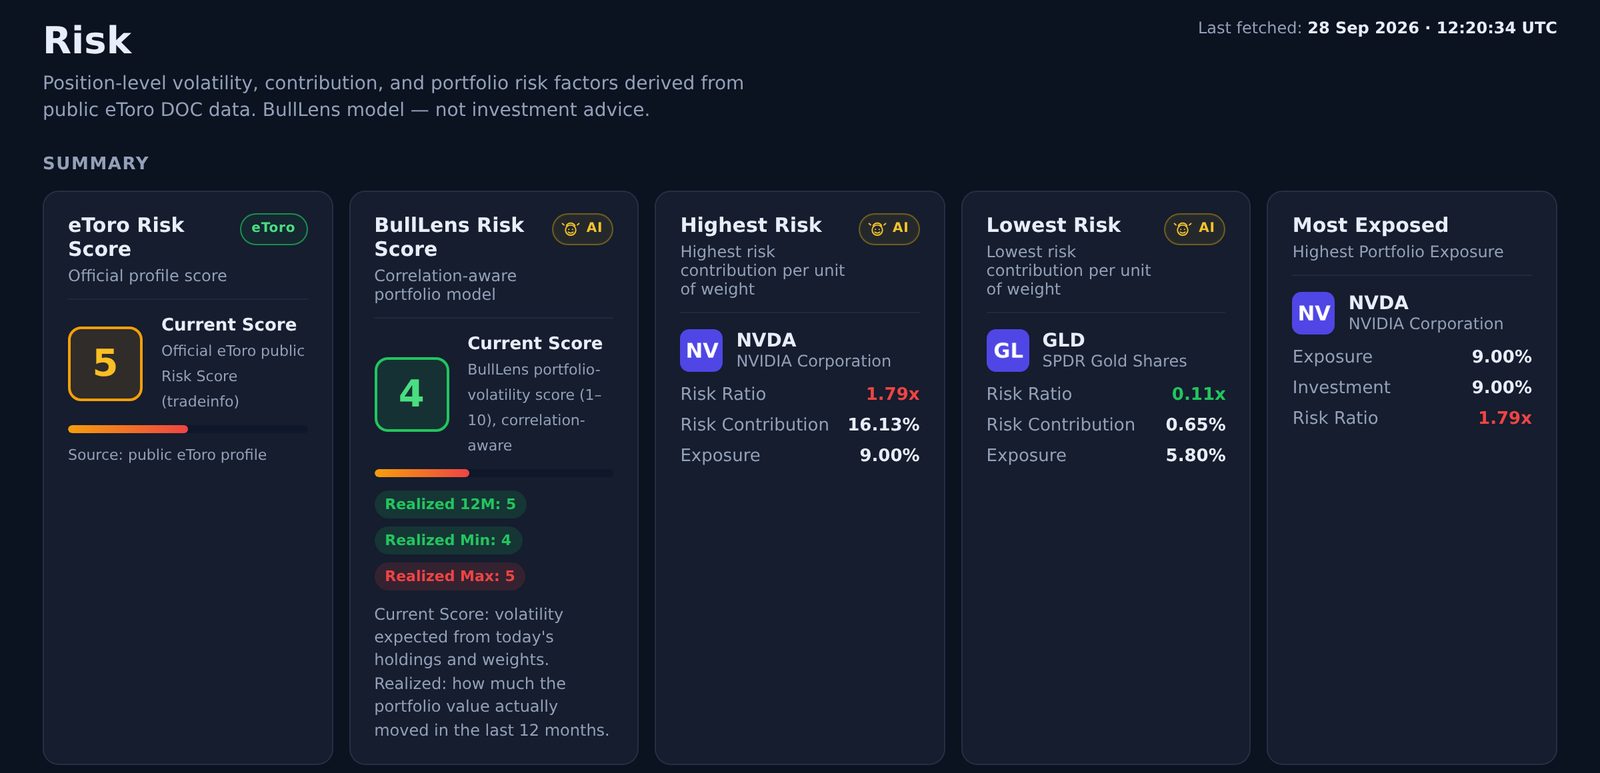
Know where your risk really sits
Your eToro Risk Score next to a correlation-aware BullLens score, the positions that add the most risk for their weight, and your drawdowns over time.
Risk contribution of every position
Worst days of the last 60 sessions and what drove them
Seasonality: how your holdings behaved in the coming months
Share
Share your results, not your amounts
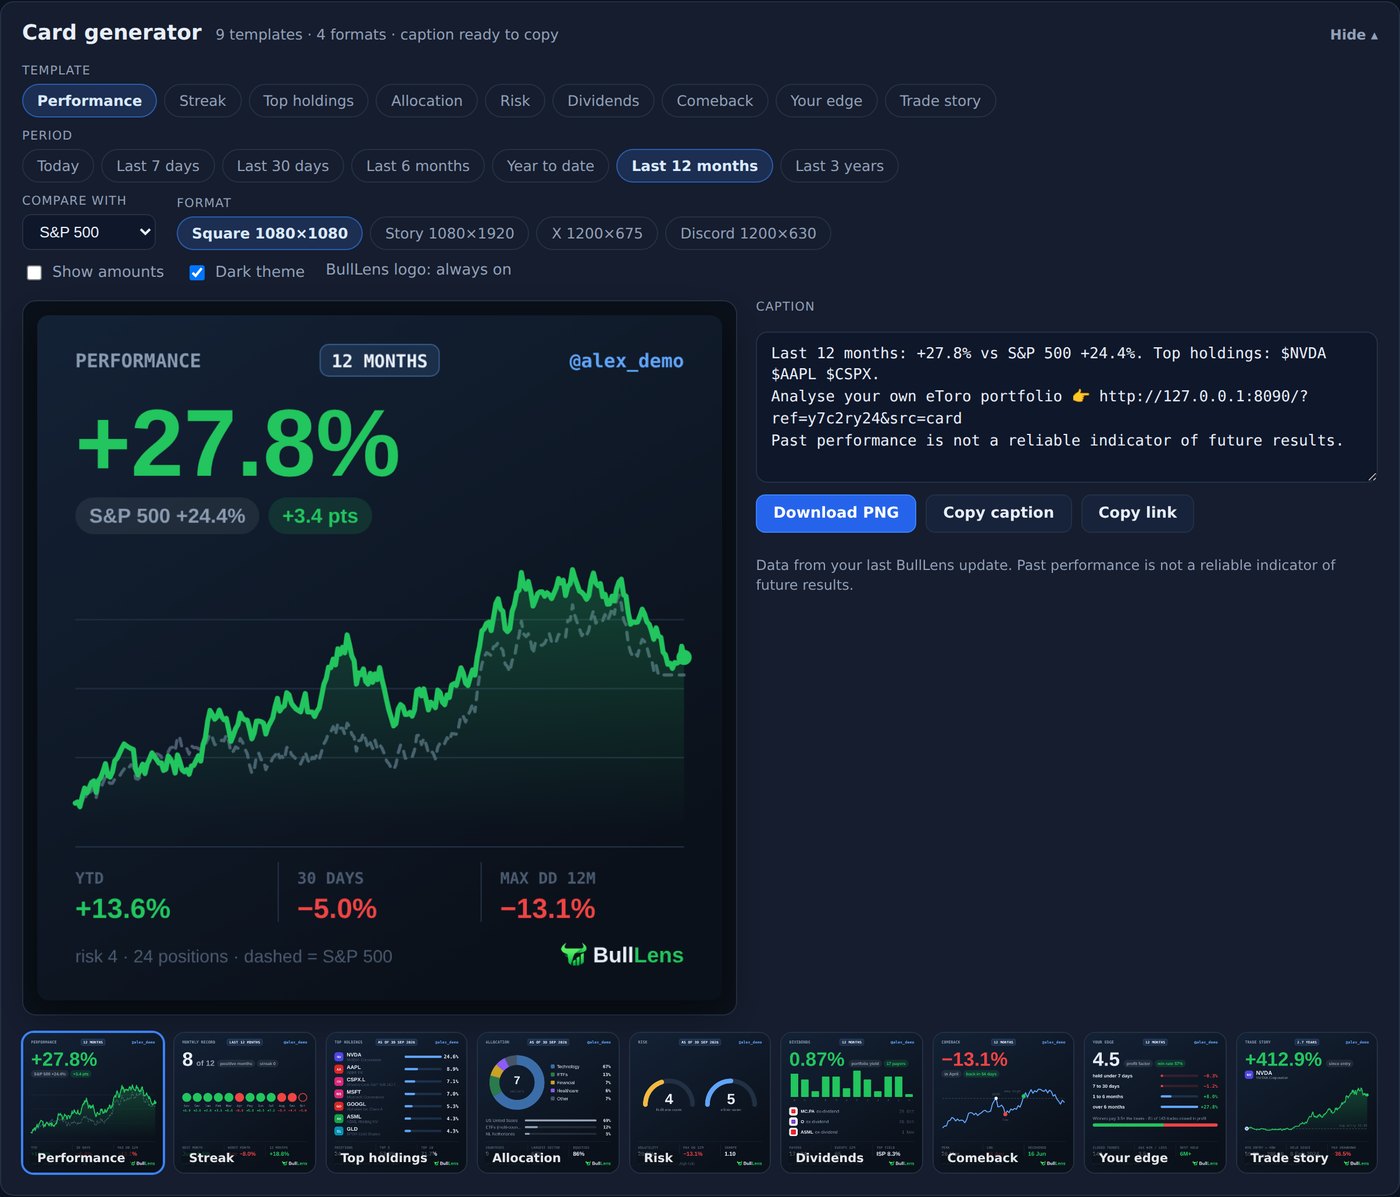
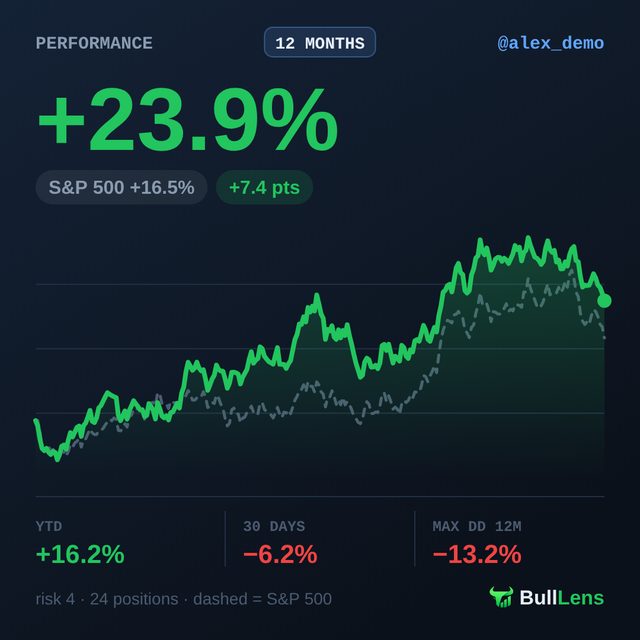
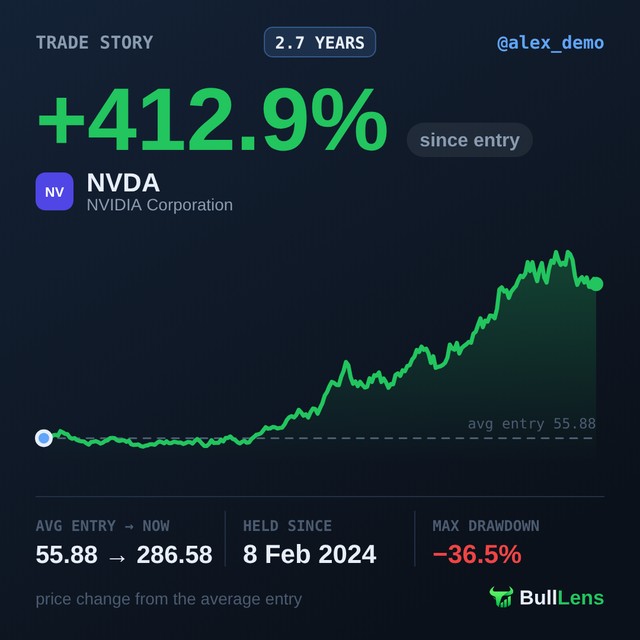
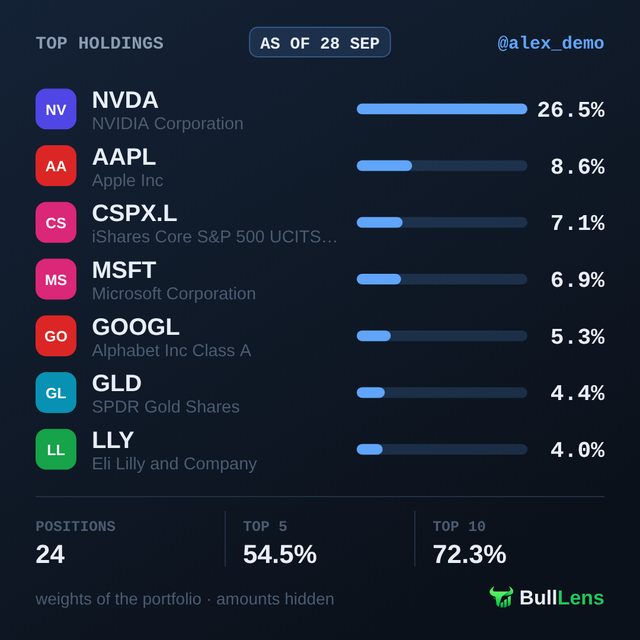
Turn a good day, a winning streak or your dividend income into a card for X, Instagram stories or Discord. Amounts stay hidden unless you choose to show them, and a caption is ready to copy.
9 templates: performance, trade story, holdings, risk, dividends and more
Wrapped: your year in slides
PDF factsheet of your portfolio
Built for eToro
Your account, your data, read-only
Read-only access
BullLens reads your portfolio through the official eToro API. It never opens or closes a position.
Encrypted access
Your eToro connection is stored encrypted and never shown again, in logs or anywhere else.
Always up to date
Your analysis refreshes in the background, and the Today view follows the market live.
Made in Italy
Designed and built in Italy by an eToro investor, with feedback from a community of beta testers.
Open your dashboard
Sign in with your BullLens account, or create one and connect your eToro portfolio.